24 API RP 584 for KAP
API RP 584, Integrity Operating Windows, is useful to KAP because it gives the work process for turning process telemetry into integrity-relevant limits, exceedance severity, damage-mechanism reasoning, and inspection-plan updates. For KAP, the most important translation is not to copy refinery tables into the product, but to convert API 584 into a visual and auditable decision layer that connects RGB and thermal inspection evidence with read-only process data.
This note summarizes which parts of API 584 are most useful to KAP and highlights the visual patterns that should influence product design. Current KAP visual scope is RGB and thermal imagery; OGI, acoustic, gas, UT, and other evidence types can be treated as roadmap or partner-supplied extensions.
24.1 Why API 584 matters to KAP
API 584 defines Integrity Operating Windows as limits on process variables that can affect equipment integrity if exceeded for a specified time. KAP already frames its core analytical chain as IOW to DMR to API 581 risk to inspection plan. API 584 provides the missing operational grammar for that first step:
- What parameters should be tracked.
- How limits should be classified as informational, standard, or critical.
- How exceedances should be ranked by risk and response time.
- Who should be notified when an exceedance occurs.
- How exceedances should feed inspection planning, RBI, MOC, and operator training.
For KAP, API 584 should become a product pattern for visualizing the boundary between normal operation, degraded operation, and integrity risk.
24.2 Highest-value concepts for KAP
| API 584 concept | Product translation for KAP | Why it matters |
|---|---|---|
| Integrity Operating Window | Per-asset or per-circuit operating envelope attached to process tags, asset metadata, and inspection evidence | Gives KAP a standards-aligned way to classify process context |
| Informational, Standard, Critical levels | Three-tier severity model shown consistently across dashboards, 3D model overlays, finding cards, and alerts | Prevents every deviation from looking like an emergency |
| Time allowed outside limit | Duration-aware exceedance scoring, not just threshold crossing | Reduces alarm fatigue and aligns with actual degradation risk |
| Leading and lagging indicators | Leading process telemetry plus lagging visual/thermal evidence | Fits KAP’s observe-reason-recommend workflow |
| Damage mechanism linkage | IOW exceedance maps to API 571 damage mechanisms and then to inspection/RBI reasoning | Connects operating condition to physical consequence |
| SME/operator response | Human-in-the-loop recommended action records | Keeps KAP read-only and defensible |
| IOW documentation template | Structured database schema for limit, duration, consequence, response, owner, and evidence | Enables auditability and customer onboarding |
24.3 Visual aspects to borrow from API 584
API 584 is visually useful because it turns integrity management into diagrams: operating zones, workflow loops, risk matrices, limit curves, and tabular IOW records. These are directly relevant to KAP’s 3D and dashboard experience.
24.3.1 Operating-zone diagram
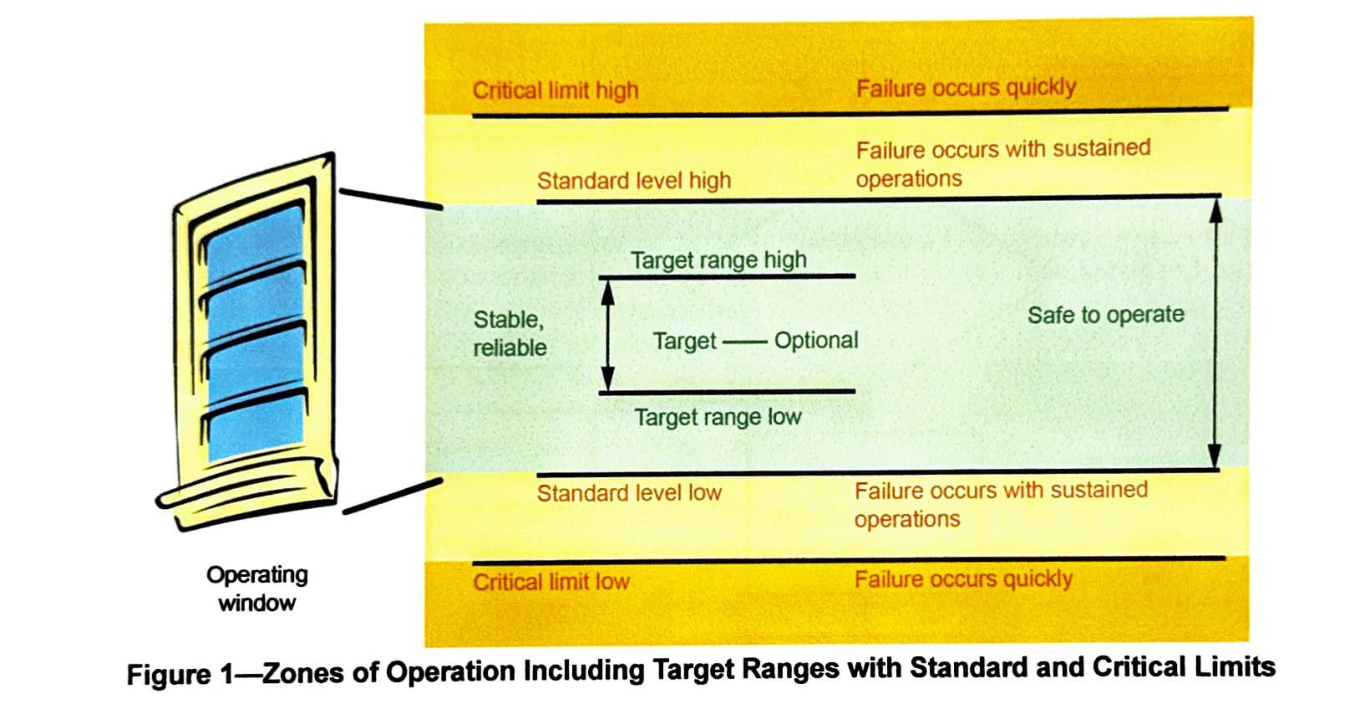
The operating-zone figure is the most important visual metaphor for KAP. It shows a target range in the center, standard limits outside the target, and critical limits at the outer boundary.
KAP product implication:
- Use the same visual grammar for asset and circuit cards: target band, standard band, critical band.
- Show the current process value as a moving marker, not just a number.
- Use duration shading to show how long the value has been outside the band.
- Apply the same band model in 3D overlays: green for target, amber for standard exceedance, red for critical exceedance, blue/gray for informational trend.
- For thermal imagery, overlay tube-skin or surface-temperature readings against informational, standard, and critical bands when a thermal calibration or asset-specific limit exists.
This is especially useful for KAP because the current visual evidence is RGB and thermal. A thermal image can be more than a heatmap if it is displayed with the asset’s integrity window.
24.3.2 IOW development workflow
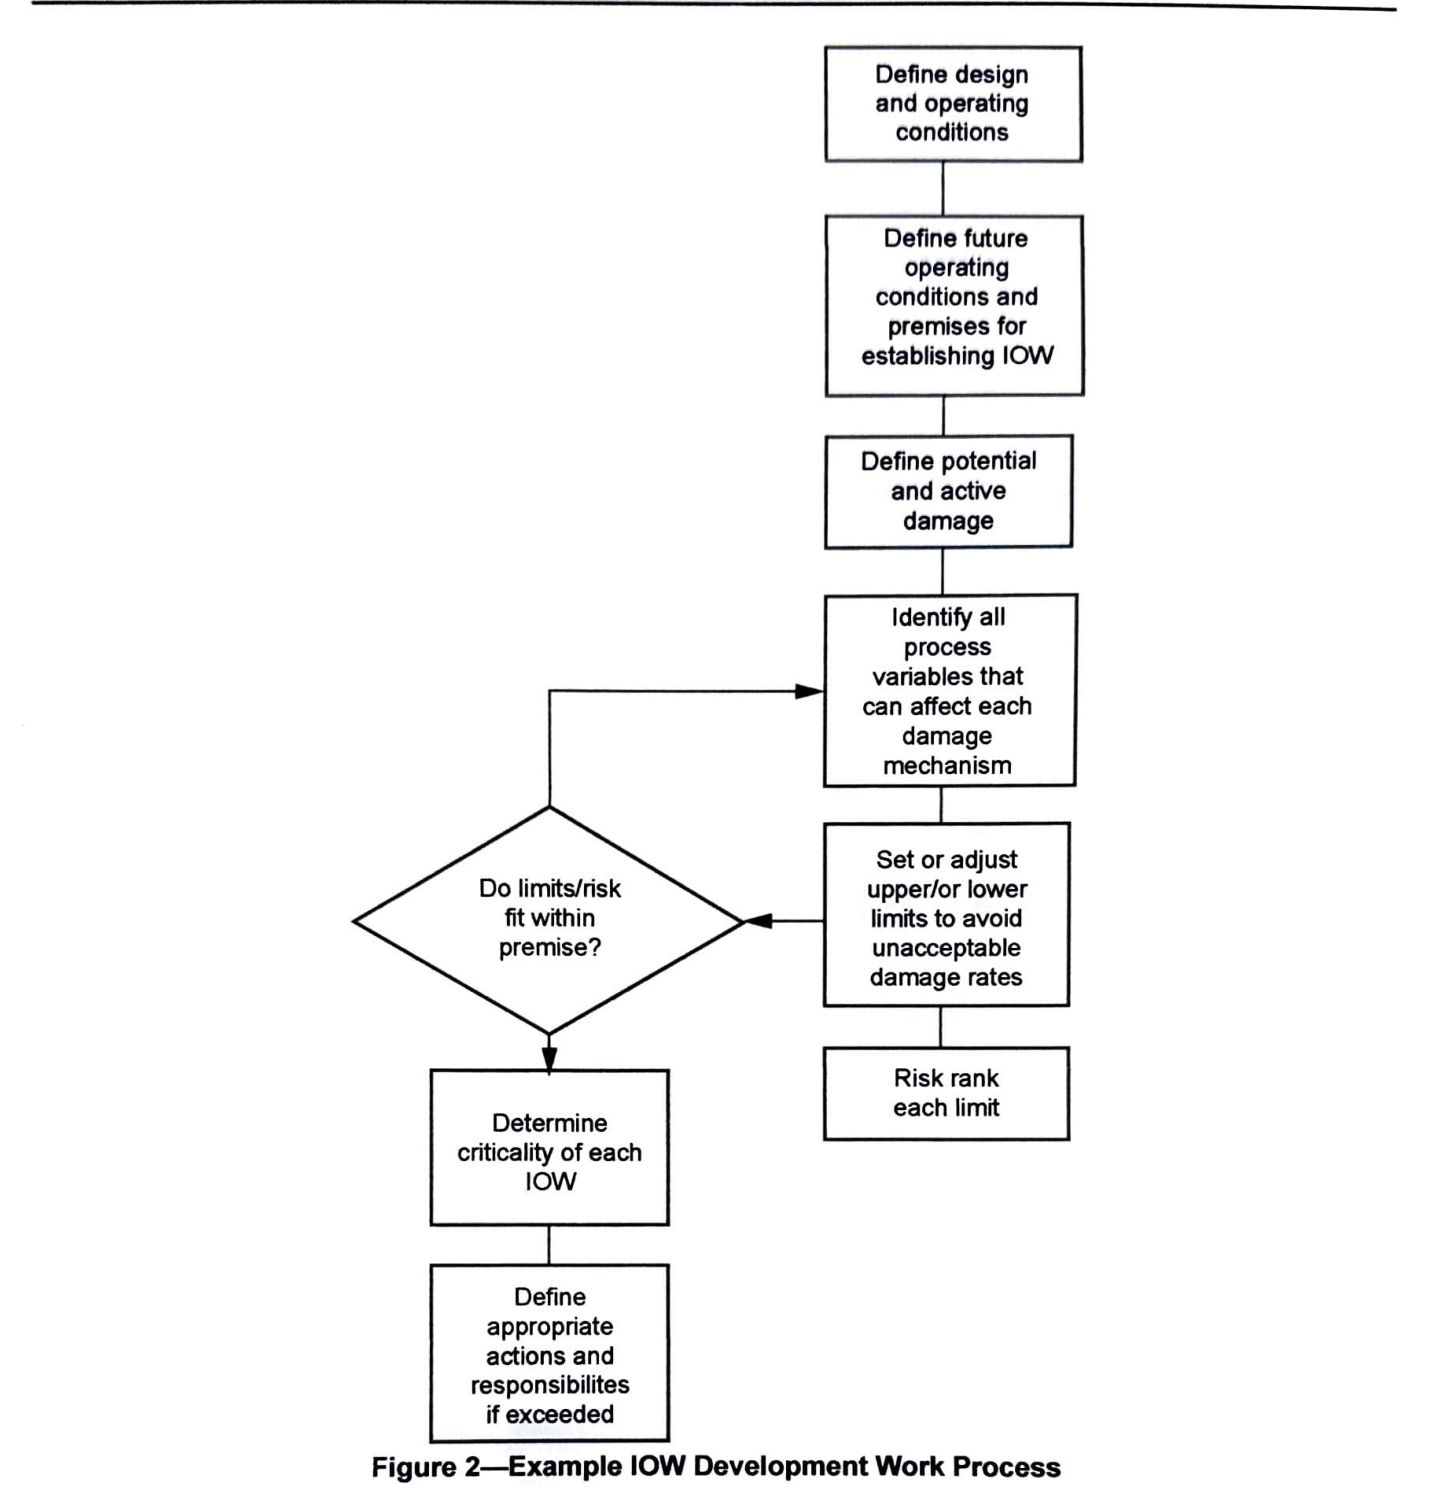
The workflow figure provides a standards-aligned sequence for KAP’s analytical chain:
- Define design and operating conditions.
- Define future operating premises.
- Identify active and potential damage mechanisms.
- Identify process variables affecting each mechanism.
- Set upper and lower limits to avoid unacceptable damage rates.
- Risk-rank each limit.
- Determine IOW criticality.
- Define response actions and responsibilities.
KAP product implication:
- Treat this as the onboarding workflow for a new unit, circuit, or asset class.
- Build an IOW setup wizard around these steps for integrity engineers.
- Store each step as provenance so the final recommendation is auditable.
- Separate engineering setup from runtime detection: KAP should not invent limits without SME approval.
24.3.3 Risk matrix
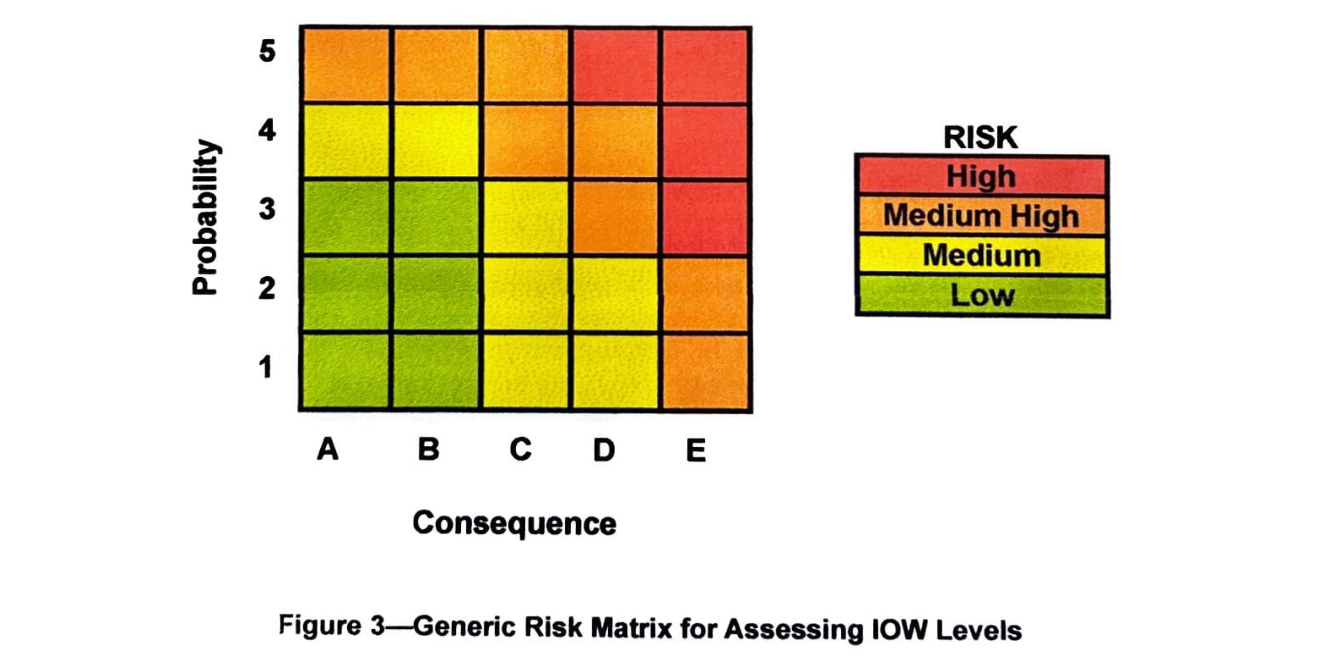
The risk matrix is useful for explaining why an exceedance becomes informational, standard, or critical. It combines probability and consequence.
KAP product implication:
- Represent IOW exceedance severity as probability x consequence, not only AI confidence.
- Show the matrix cell that caused the recommendation.
- Let engineers inspect both axes: likelihood/time-to-failure and consequence category.
- Keep AI confidence visually separate from engineering risk. A high-confidence thermal anomaly is not automatically high risk unless consequence and damage mechanism support it.
24.3.4 Action chart
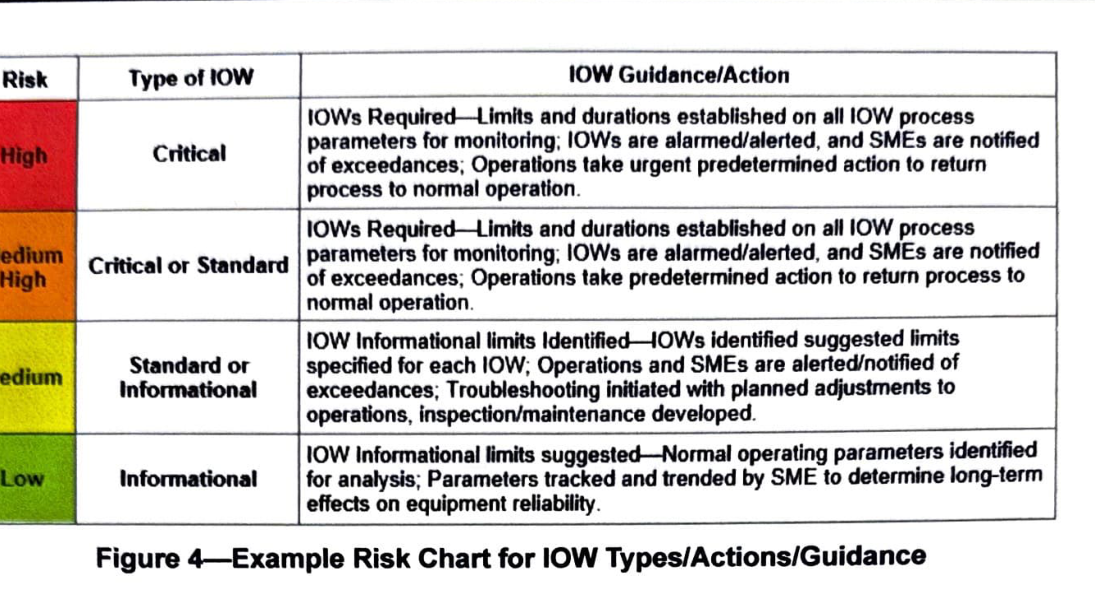
The action chart maps IOW type to required action: urgent operator action for critical limits, predetermined action for standard limits, troubleshooting and SME review for informational limits.
KAP product implication:
- Every finding card should show the response class, not only the detected anomaly.
- Recommended actions should be role-specific: operator, process engineer, inspection engineer, corrosion/materials SME.
- KAP should preserve its read-only boundary by presenting actions as recommendations and evidence packets, not control commands.
- Escalation should be explicit: who is notified, by when, and why.
24.3.5 Co-dependent limit plot
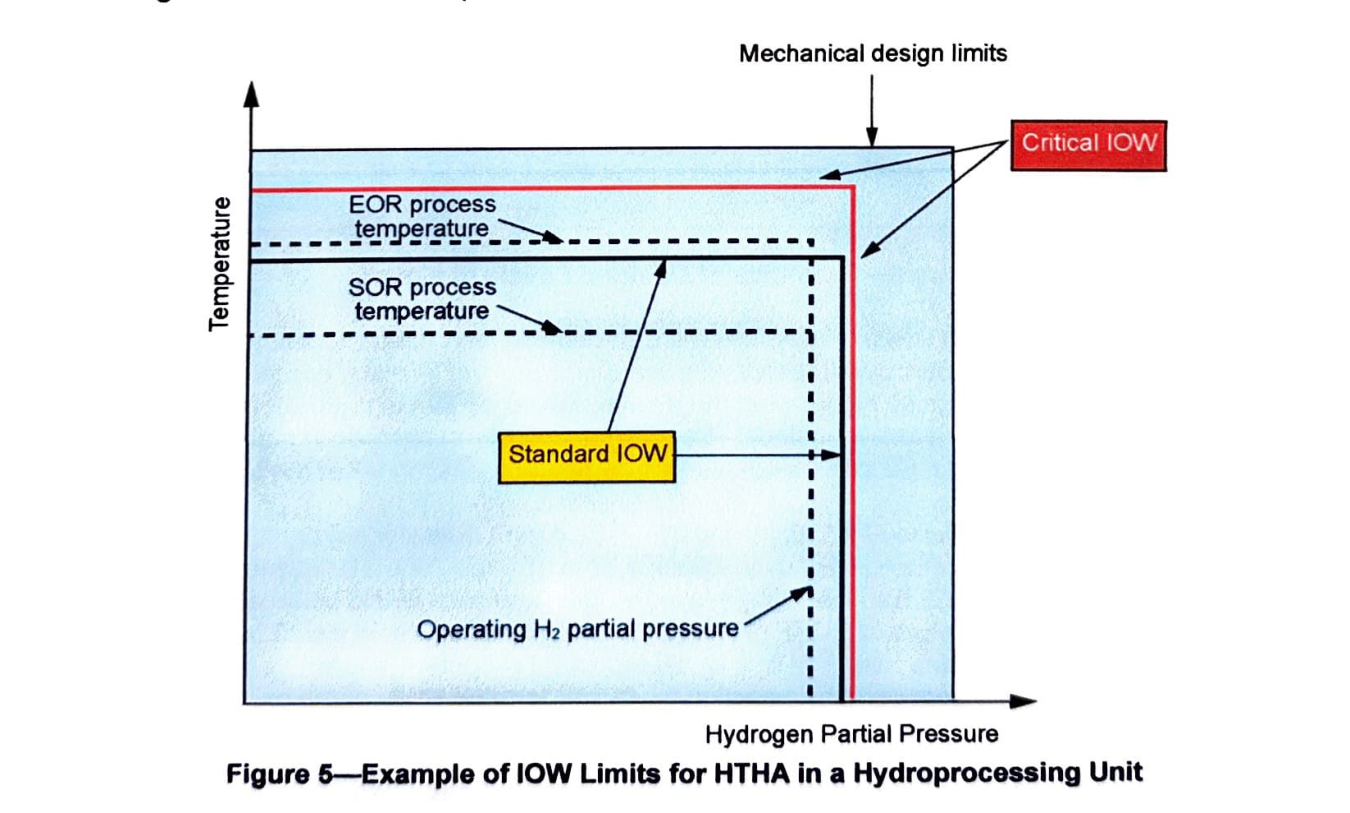
The HTHA example is valuable because it shows that many integrity limits are not single thresholds. They can depend on multiple variables such as temperature and hydrogen partial pressure, and can also depend on exposure duration.
KAP product implication:
- Support multi-variable windows, not just scalar high/low limits.
- Plot operating points against engineering curves when the mechanism requires it.
- For thermal imagery, do not infer mechanism from temperature alone when pressure, material, fluid chemistry, and exposure time are required.
- Use the plot as an explanation view for engineer review: current point, historical trail, limit curve, design boundary, and recommended inspection consequence.
24.3.6 Multi-level heater temperature view
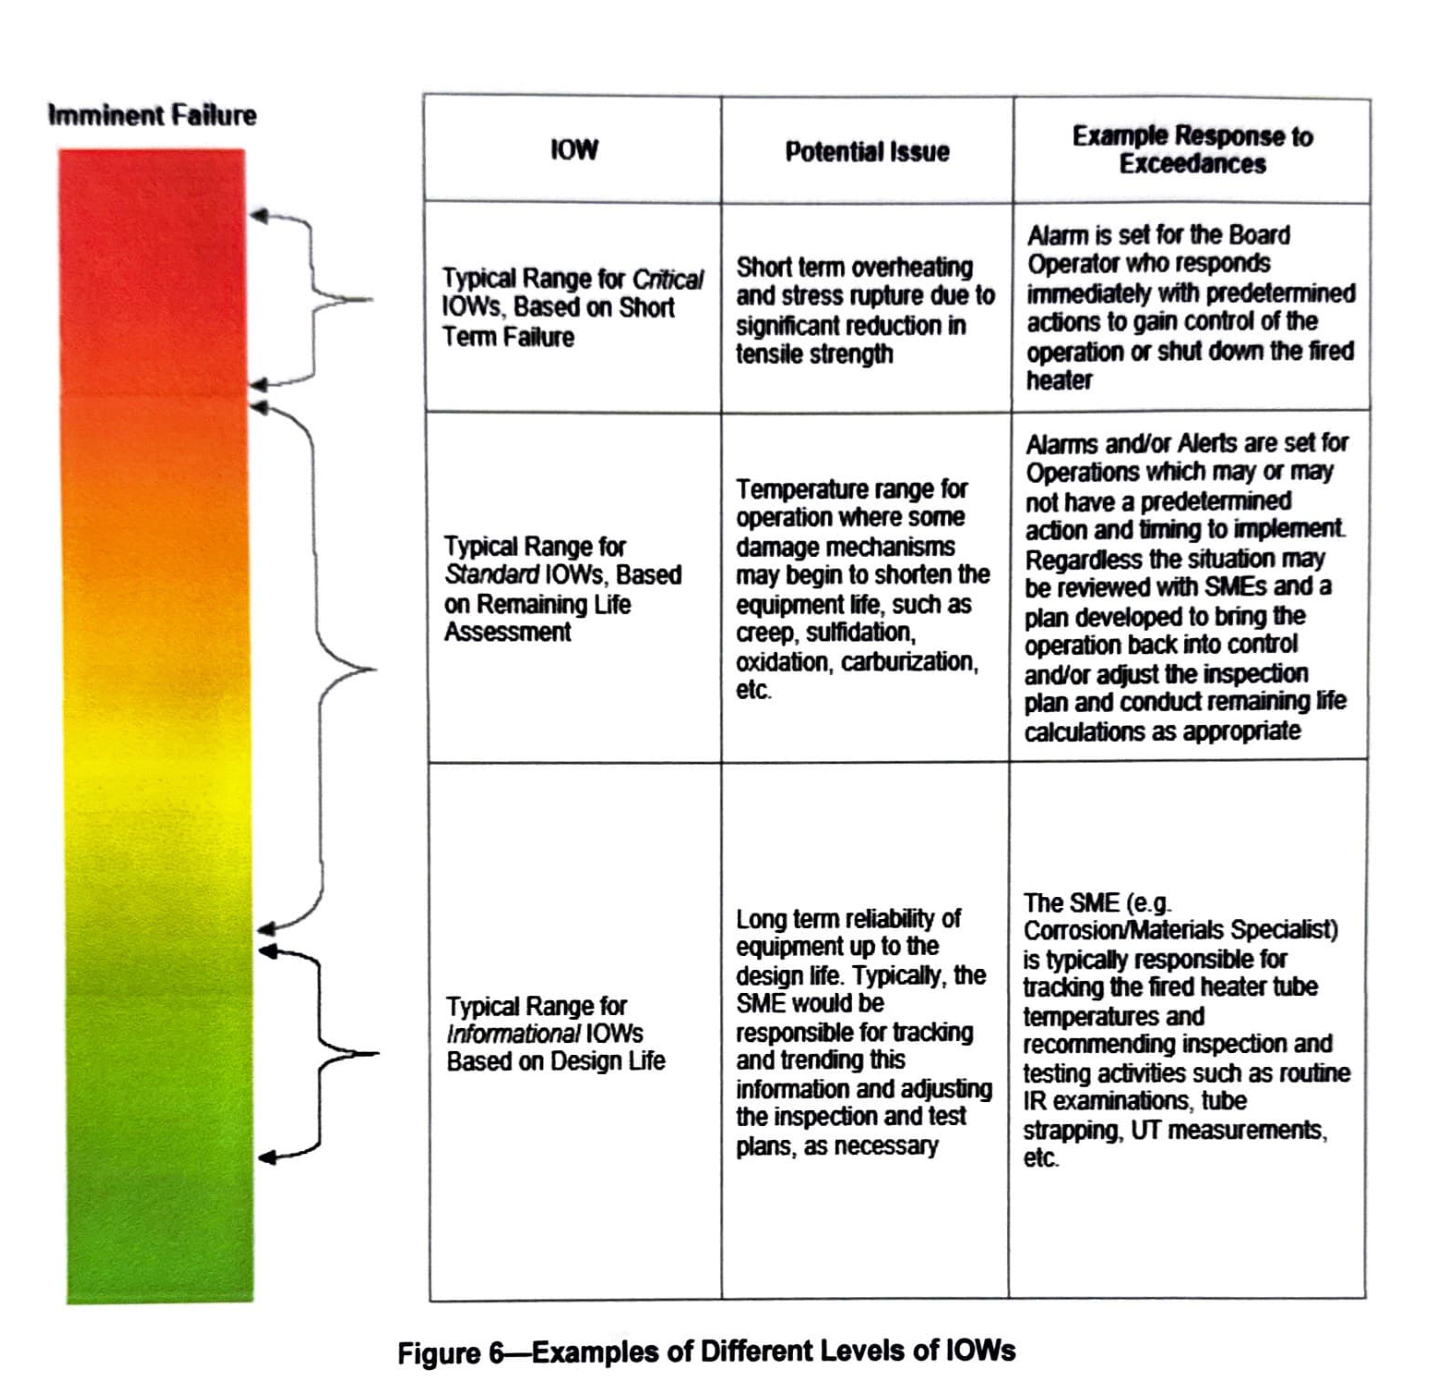
The fired-heater example is the closest visual match to KAP’s current RGB and thermal capability. It distinguishes informational, standard, and critical temperature ranges for heater tubes and ties each range to likely damage, response urgency, and inspection activity.
KAP product implication:
- Use thermal images to monitor relative hot spots, tube temperature trends, and spatial temperature distribution.
- Display temperature bands on top of thermal imagery when calibrated values are available.
- When values are not calibrated, present thermal evidence as qualitative or relative evidence, not an API-limit exceedance.
- Surface repeat hot spots across patrols as trend evidence, especially where the same location repeatedly approaches a known limit.
- Connect heater thermal findings to likely mechanisms such as creep, short-term overheating, stress rupture, sulfidation, oxidation, carburization, and fouling, but require engineer review for final mechanism assignment.
24.4 API 584 parts most useful to KAP
24.4.1 Definitions and classification
Sections defining IOWs, operating envelopes, critical limits, standard limits, informational limits, alarms, alerts, and notifications are directly useful. KAP should mirror this language in the data model and UI so refinery users recognize the workflow.
Recommended KAP objects:
| Object | Key fields |
|---|---|
| IOW parameter | asset_id, circuit_id, tag_id, parameter_type, unit, measurement_source |
| IOW limit | min_limit, max_limit, target_range, level, allowed_duration, basis, approver |
| Exceedance event | start_time, end_time, intensity, duration, level, evidence_links, severity_score |
| Response plan | owner_role, required_action, response_time, notification_path, inspection_follow-up |
| Engineering basis | damage_mechanism, materials, corrosion circuit, API reference, assumptions, MOC link |
24.4.2 Parameters that may require IOWs
API 584 divides parameters into chemical and physical categories. KAP should model both, but the initial visual product should focus on what RGB and thermal can support.
Useful physical parameters for current KAP:
- Surface or tube-skin temperature from thermal imagery.
- Process temperature from SCADA/historian, read-only.
- Temperature differentials between parallel tubes, banks, or equipment zones.
- Flow-related indicators when available from SCADA, especially for heaters and wash-water systems.
- Pressure drop and fouling indicators where historian tags exist.
- Dew point or salt point margin where calculated from process data.
Useful chemical parameters for later or partner data ingestion:
- pH, chlorides, H2S, NH3, NH4HS, TAN, sulfur, cyanides, iron, acid strength, inhibitor concentration.
- These are typically lab, analyzer, or historian values rather than RGB/thermal observations.
- KAP should ingest and reason over them, but should not visually imply they are detected from camera imagery.
24.4.3 Leading and lagging indicators
API 584 distinguishes leading indicators that predict damage potential from lagging indicators that reveal damage or corrosion after it has begun.
KAP mapping:
| Indicator type | Examples | KAP role |
|---|---|---|
| Leading | temperature, pressure, pH, chloride, sulfur, wash-water rate, dew point margin | Predicts credible damage mechanisms before visual evidence appears |
| Lagging | thermal hot spot, corrosion product in RGB, insulation staining, observed leak, UT loss, iron in sample | Validates or challenges the predicted mechanism |
With only RGB and thermal images, KAP is strongest at lagging or circumstantial physical evidence. SCADA/historian integration is what lets KAP become predictive.
24.4.4 Risk ranking
API 584’s risk ranking should inform KAP’s severity engine. The severity of an IOW exceedance should combine:
- Limit level: informational, standard, critical.
- Duration outside limit.
- Intensity or margin beyond the limit.
- Damage mechanism plausibility.
- Asset material and service.
- Consequence category.
- Visual or thermal corroboration.
- Inspection history and remaining-life context.
This avoids two bad outcomes: treating every thermal anomaly as critical, or treating every process exceedance as abstract until a leak occurs.
24.4.5 Documentation and training
API 584 emphasizes documenting limits, response actions, responsibilities, and training. KAP should treat this as a customer-facing trust feature.
Recommended product views:
- IOW basis view: why this limit exists.
- Exceedance timeline: when it happened and how long it lasted.
- Evidence packet: RGB, thermal, process trends, CAD/P&ID tag, prior inspections.
- Response log: what KAP recommended, who reviewed it, and what action was taken outside KAP.
- Training mode: explain what happens if the limit is ignored.
24.5 What KAP can do now with RGB and thermal
Current KAP can use API 584 most safely as a context and explanation layer around visual findings.
High-confidence current use cases:
- Thermal anomaly triage on heaters, exchangers, vessels, insulated equipment, and piping circuits.
- RGB detection of visible degradation indicators such as staining, coating breakdown, corrosion products, leaks, insulation damage, missing cladding, and steam/condensate evidence.
- Repeated-location trend analysis across campaigns or patrols.
- Visual evidence packets attached to IOW exceedance events from SCADA/historian, when available.
- 3D spatial overlays showing which assets are operating near or outside integrity windows.
Current limitations to state clearly:
- RGB and thermal do not directly measure chemistry such as chloride, pH, TAN, NH4HS, or sulfur.
- Thermal imagery does not by itself prove HTHA, creep, sulfidation, ammonium chloride corrosion, or under-deposit corrosion.
- Quantitative API-limit comparisons require calibrated thermal data, asset identity, emissivity assumptions, measurement location, and approved limits.
- Critical severity and remaining-life adjustment should require qualified engineer review.
24.6 Priority product patterns
24.6.1 Integrity window strip
A compact horizontal strip for each key parameter:
- Center target band.
- Amber standard zone.
- Red critical zone.
- Marker for current value.
- Tail showing recent trend.
- Duration badge for time outside limit.
Use in asset cards, 3D hover panels, and finding detail pages.
24.6.2 Thermal evidence with limit bands
For thermal inspection frames:
- Show the original thermal image.
- Overlay asset segmentation or tube/circuit region.
- Show max, mean, and delta temperature for the selected region.
- Show whether the value is informational, standard, or critical only if calibrated and approved.
- Otherwise label it as relative thermal anomaly evidence.
24.6.3 IOW exceedance timeline
For a selected asset:
- Plot process tag trend over time.
- Shade informational, standard, and critical ranges.
- Mark RGB/thermal captures on the same timeline.
- Mark inspection events, engineer review, and recommended actions.
This is one of the clearest ways to connect process data with images.
24.6.4 3D risk overlay
In the 3D plant model:
- Color assets by active highest IOW state.
- Use icons for evidence type: RGB, thermal, process, lab, UT.
- Differentiate single-source detection from cross-source confirmed finding.
- Let users click through to the evidence packet and IOW basis.
24.6.5 Engineer review packet
For each significant finding, provide:
- Asset and circuit identity.
- Current IOW state.
- Visual evidence thumbnails.
- Thermal trend and image overlays.
- Related process tags.
- Candidate damage mechanisms.
- Risk matrix placement.
- Recommended action and response owner.
- Human approval controls.
24.7 Candidate KAP feature requirements
| ID | Requirement | API 584 basis | Status fit |
|---|---|---|---|
| LIB-584-01 | KAP shall store IOW parameters with target, standard, critical, and informational levels where approved by an engineer. | Sections on IOW levels and documentation | Q3/Q4 data model |
| LIB-584-02 | KAP shall score exceedances using duration and margin beyond limit, not threshold crossing alone. | Time allowed outside limits; risk ranking | Q3 analytics |
| LIB-584-03 | KAP shall attach RGB and thermal evidence to IOW exceedance events when spatially and temporally correlated. | Monitoring, measurement, SME notification | Q2/Q3 visual workflow |
| LIB-584-04 | KAP shall distinguish calibrated thermal limit exceedance from relative thermal anomaly. | Measurement accuracy and location considerations | Immediate UI/UX guardrail |
| LIB-584-05 | KAP shall require engineer review for critical IOW findings, complex damage mechanisms, and remaining-life changes. | Response ownership and SME roles | Existing human-in-loop rule |
| LIB-584-06 | KAP shall present an IOW basis view showing damage mechanism, asset/circuit, source tag, assumptions, response plan, and approver. | Annex B sample format | Q3/Q4 auditability |
| LIB-584-07 | KAP shall visualize multi-variable limits where a mechanism depends on more than one process variable. | HTHA example and co-dependent variables | Q4/advanced |
| LIB-584-08 | KAP shall support IOW health review dashboards showing recurring exceedances, missing data, stale tags, and unimplemented monitoring requirements. | Barriers to successful implementation | Q4 operations |
24.8 Asset classes and examples relevant to KAP
24.8.1 Fired heaters
Most visually relevant because thermal imagery maps directly to tube-skin temperature patterns.
Relevant API 584 ideas:
- Informational, standard, and critical tube-temperature limits.
- Minimum pass flow and flow imbalance as context for thermal findings.
- Tube outlet temperature differential.
- Short-term overheating and stress rupture as urgent scenarios.
- Creep and corrosion as longer-duration scenarios.
KAP visual emphasis:
- Thermal hot-spot maps.
- Tube-to-tube temperature delta.
- Repeated hot-spot history.
- RGB confirmation of external damage, flame impingement evidence where visible, refractory issues, or staining.
24.8.2 Heat exchangers
Relevant because API 584’s Annex C example shows how a limiting component can drive an IOW.
Relevant API 584 ideas:
- Operating temperature and sulfur/TAN context for corrosion rate.
- Pressure drop and heat-transfer change as fouling indicators.
- Inlet/outlet temperature changes as leading indicators.
KAP visual emphasis:
- External thermal pattern change.
- Fouling indications from thermal gradients if visible.
- RGB evidence of leaks, corrosion staining, insulation damage, or exchanger bundle-area issues.
24.8.3 Piping circuits
Relevant because KAP’s 3D model and RGB/thermal patrols can spatially register recurring anomalies.
Relevant API 584 ideas:
- Circuit-level IOWs tied to materials, service, and damage mechanism.
- Flow velocity, pH, chloride, sour water chemistry, dew point/salt point margins.
KAP visual emphasis:
- Corrosion product and staining detection.
- Insulation jacket damage.
- Thermal anomalies suggesting wet insulation, tracing issues, or abnormal heat loss.
- 3D line-number/P&ID linkage where available.
24.8.4 Crude, hydroprocessing, FCC, amine, sour water, and coker units
Annex A lists many possible IOW parameters for generic refinery process units. KAP should use these tables as onboarding checklists, not as default limits.
Important product rule:
- Annex A parameters help prompt the engineer during configuration.
- Site-specific limits must be approved by customer SMEs.
- KAP should not ship universal numeric limits for these units without engineering validation.
24.9 Recommended library follow-up
This document should become the first page in a broader KAP standards library. Useful next pages would be:
- API 571 for damage mechanism vocabulary and visual evidence mapping.
- API 580/581 for RBI risk scoring and inspection interval logic.
- API 970 for corrosion control documents and corrosion-circuit structure.
- API 530 and API 573 for fired-heater tube-temperature workflows.
24.10 Bottom line
The most useful part of API 584 for KAP is the visual and operational structure of integrity limits: target range, informational trend, standard exceedance, critical exceedance, response time, and SME action. KAP should turn those concepts into visual overlays and evidence packets that combine read-only process data with RGB and thermal inspection evidence.
For the current product, the strongest API 584-aligned story is fired-heater and heat-exchanger monitoring: thermal images supply visible physical evidence, RGB supplies contextual degradation evidence, and IOWs supply the standards-aligned operating envelope that tells the engineer whether the observation matters.